The interactive map investigates the geochemical footprint created by European occupation, which began in earnest after the 600-acre Bundanon property was granted to Richard Henry Browne in the 1830s (see also ENVIRONMENTAL HISTORY). This project analyses soil across the site to assess the land at Bundanon for ‘footprints’ of former human activities. Values have been benchmarked against natural background values to understand the extent and impact of anthropogenic activity.
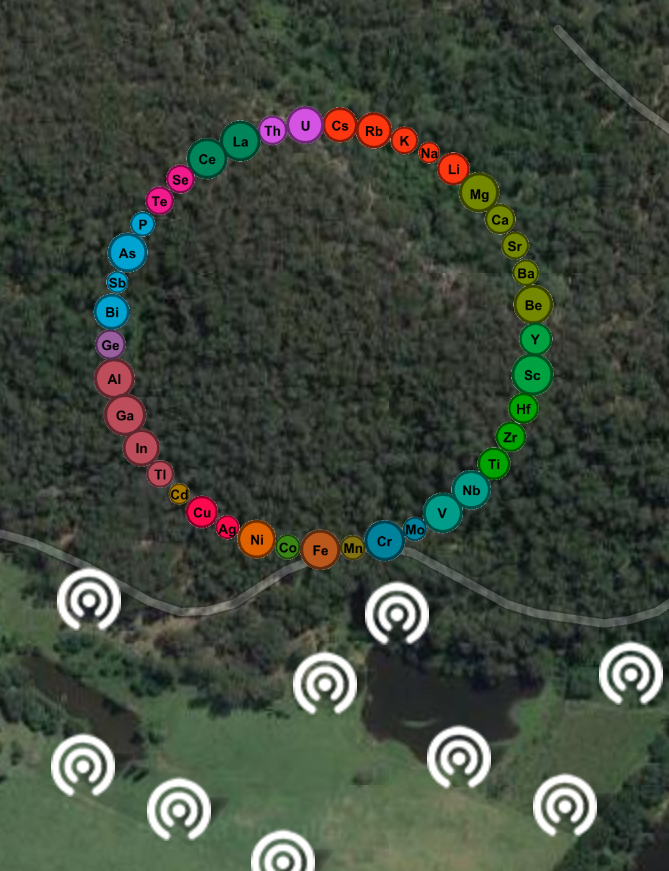
The map features 37 data-points of soil samples taken around the Bundanon homestead. These 37 points are a selection from 122 soil samples tested for 53 trace elements. The complete data set of all 122 soil samples is available here. The analysis of the soil samples by Professor Mark Taylor is at FOOTPRINTS AND FINGERPRINTS.
Positioning the cursor over an icon will reveal its co-ordinates as a data-point, eg. H2S2, identifying that site within the data set of 122 points. Clicking on the icon releases a representation of the environmental data in sound and image. The user hears a sonification of the data, represented as a musical piece, and sees a visualisation of the mineral data as a graphic display. To close the display, simply click on another icon, or click anywhere else on the map.
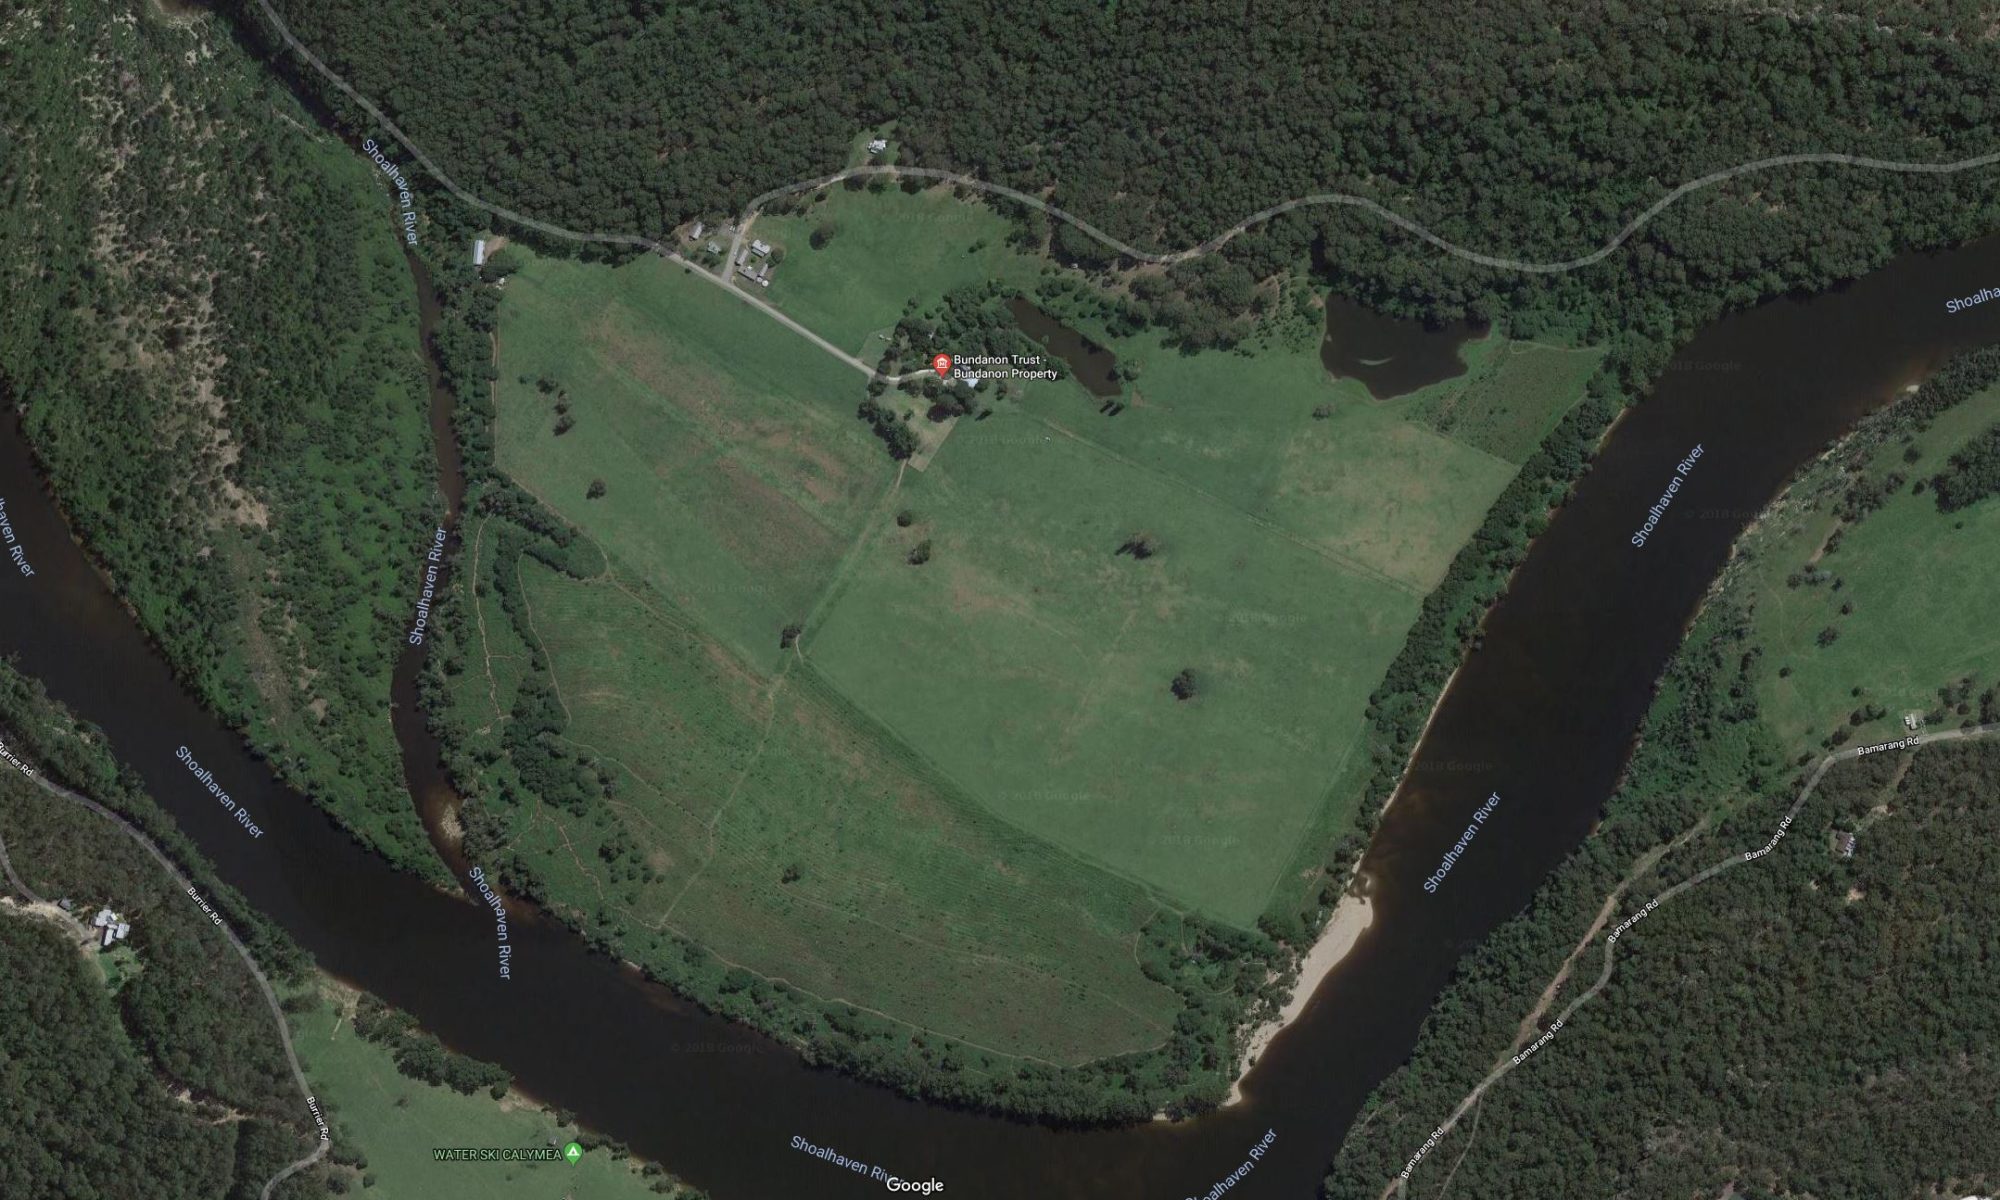
The map displays a section of the Bundanon property and Shoalhaven River. The building marked ‘Bundanon Trust – Bundanon Property’ on the map is the Bundanon homestead, former home of Arthur Boyd. The rose garden at the rear of the homestead is at data-point W2S2. Arthur Boyd’s studio is at P1S1. The other buildings visible near the homestead are the contemporary artists’ studios, accommodation for visiting artists-in-residence. The writers’ cottage and dance studio are positioned together, while the musicians’ cottage is at H2S2. Other features of historical significance visible on the map are the single man’s hut at H168, the dam at D1S5, and the later-built homestead dam at W3S2.