The interactive map provides a representation of environmental data at 37 points, displaying that data as sound and image. For both the sonification and visualisation of data we employed a cut-off threshold, so that elements measured at the lower limit of their normalised data are not displayed. This allows the audio and visual display to focus on the most evident elements at each particular site.
Normalisation We have used a statistical process of normalisation so that the subtle variations of less common elements can be distinguished from the overwhelming abundance of extremely common elements, which in fact form the majority of every sample site. Common elements such as silica and iron for example would by simple percentage overwhelm rarer elements in the display. In our normalisation process each element has been treated individually as a distribution across all sample sites, and is therefore not in competition with other elements.
The full data-set, without normalisation, showing mineral composition of the 122 data points, is here.
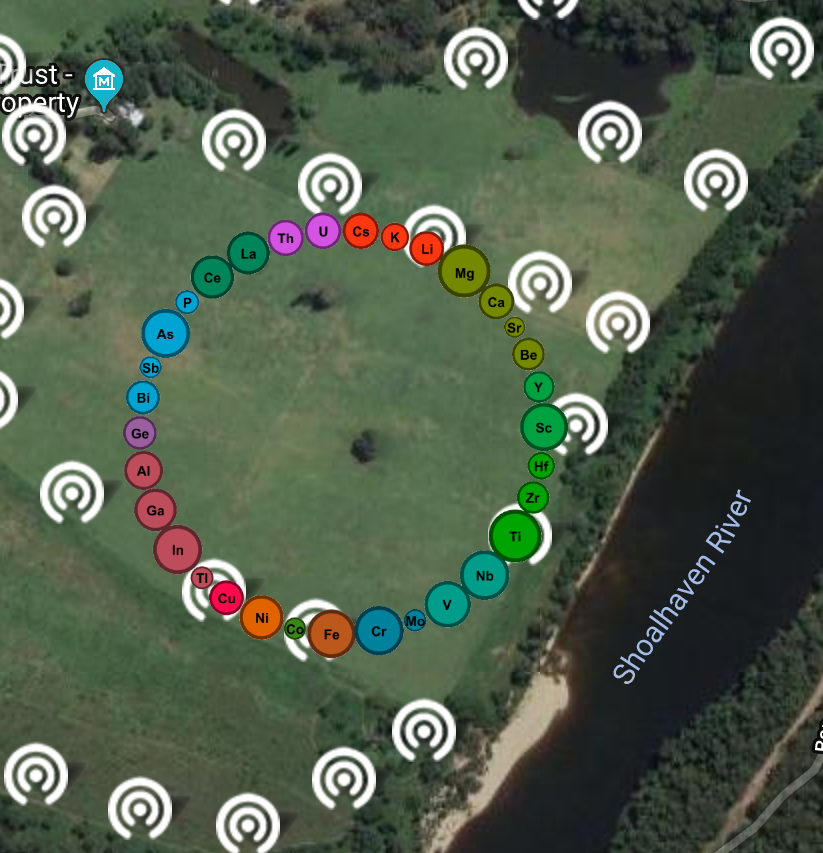
Visualisation The elements present at a specific location are visualised using a circle of element labels. The size of the individual element label circles in the ring of elements represents the amount of the element present at that location, relative to normalised measurements made across the whole site. Colour is used to identify the element’s grouping in the periodic table which is traditionally organised so that elements are grouped by similar physical or chemical characteristics.
Sonification To create the sonification we mapped element numbers from the periodic table to musical notes, using an equal tempered scale. In our mapping, elements with low atomic numbers become low frequencies, and elements with high atomic numbers become high frequencies. The sound for each element is signified by a pure sine tone. The tempo of the element note pulses and volume are determined by the amount of the element present at that location, relative to normalised measurements made across the whole site (represented by the circle size). This means that faster, louder pulses indicate a relative abundance of that element and slower, softer pulses indicate that less of that element is present.